Introduction
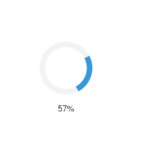
When building web applications that involve displaying large datasets, it’s essential to keep users informed about the loading process. A loading spinner with a percentage indicator can significantly enhance user experience by providing visual feedback on the progress of data loading. In this tutorial, we’ll walk you through the steps to create a spinner with a loading data percentage for a DataTable.
Prerequisites
Before we start, ensure you have the following:
- Basic knowledge of HTML, CSS, and JavaScript.
- jQuery library.
- DataTables library.
Step-by-Step Guide
1. Setting Up the HTML Structure
First, create the HTML structure for your DataTable and the loading spinner. The spinner will be overlaid on top of the DataTable while data is being loaded.
<!DOCTYPE html>
<html lang="en">
<head>
    <meta charset="UTF-8">
    <meta name="viewport" content="width=device-width, initial-scale=1.0">
    <title>DataTables with Loading Percentage</title>
    <link rel="stylesheet" href="https://cdn.datatables.net/1.11.3/css/jquery.dataTables.min.css">
    <style>
        /* Loader CSS */
        #loader {
            position: fixed;
            top: 0;
            left: 0;
            width: 100%;
            height: 100%;
            background: rgba(255, 255, 255, 0.8);
            display: flex;
            justify-content: center;
            align-items: center;
            flex-direction: column;
            z-index: 9999;
        }
        .spinner {
            border: 16px solid #f3f3f3;
            border-top: 16px solid #3498db;
            border-radius: 50%;
            width: 120px;
            height: 120px;
            animation: spin 2s linear infinite;
        }
        @keyframes spin {
            0% { transform: rotate(0deg); }
            100% { transform: rotate(360deg); }
        }
        #percentage {
            margin-top: 20px;
            font-size: 1.5em;
        }
    </style>
</head>
<body>

<div id="loader">
    <div class="spinner"></div>
    <div id="percentage">0%</div>
</div>

<table id="example" class="display" style="width:100%">
    <thead>
        <tr>
            <th>Name</th>
            <th>Position</th>
            <th>Office</th>
            <th>Age</th>
            <th>Start date</th>
            <th>Salary</th>
        </tr>
    </thead>
</table>

<script src="https://code.jquery.com/jquery-3.6.0.min.js"></script>
<script src="https://cdn.datatables.net/1.11.3/js/jquery.dataTables.min.js"></script>
<script>
    $(document).ready(function() {
        let percentage = 0;
        const totalData = 1000;  // Adjust this according to your actual data size

        // Function to update the loader percentage
        function updatePercentage(increment) {
            percentage += increment;
            $('#percentage').text(Math.min(Math.floor((percentage / totalData) * 100), 100) + '%');
        }

        // Simulate data loading with AJAX (you can replace this with your actual AJAX call)
        let data = [];
        for (let i = 0; i < totalData; i++) {
            // Simulate network latency
            setTimeout(() => {
                data.push({
                    name: 'Name ' + i,
                    position: 'Position ' + i,
                    office: 'Office ' + i,
                    age: Math.floor(Math.random() * 100),
                    start_date: '2021-01-01',
                    salary: Math.floor(Math.random() * 100000)
                });
                updatePercentage(1);

                if (i === totalData - 1) {
                    // Initialize DataTable with the fetched data
                    $('#example').DataTable({
                        data: data,
                        columns: [
                            { data: 'name' },
                            { data: 'position' },
                            { data: 'office' },
                            { data: 'age' },
                            { data: 'start_date' },
                            { data: 'salary' }
                        ]
                    });

                    // Hide the loader once the data is fully loaded
                    $('#loader').fadeOut();
                }
            }, i);
        }
    });
</script>

</body>
</html>
2. Adding CSS for the Loader
The CSS code ensures the loader is styled correctly and positioned to cover the entire screen while the data is being loaded.
/* Loader CSS */
#loader {
    position: fixed;
    top: 0;
    left: 0;
    width: 100%;
    height: 100%;
    background: rgba(255, 255, 255, 0.8);
    display: flex;
    justify-content: center;
    align-items: center;
    flex-direction: column;
    z-index: 9999;
}
.spinner {
    border: 16px solid #f3f3f3;
    border-top: 16px solid #3498db;
    border-radius: 50%;
    width: 120px;
    height: 120px;
    animation: spin 2s linear infinite;
}
@keyframes spin {
    0% { transform: rotate(0deg); }
    100% { transform: rotate(360deg); }
}
#percentage {
    margin-top: 20px;
    font-size: 1.5em;
}
3. Writing the JavaScript for Data Loading
The JavaScript code handles data loading, updates the percentage indicator, and initializes the DataTable once all data is loaded.
$(document).ready(function() {
    let percentage = 0;
    const totalData = 1000;  // Adjust this according to your actual data size

    // Function to update the loader percentage
    function updatePercentage(increment) {
        percentage += increment;
        $('#percentage').text(Math.min(Math.floor((percentage / totalData) * 100), 100) + '%');
    }

    // Simulate data loading with AJAX (you can replace this with your actual AJAX call)
    let data = [];
    for (let i = 0; i < totalData; i++) {
        // Simulate network latency
        setTimeout(() => {
            data.push({
                name: 'Name ' + i,
                position: 'Position ' + i,
                office: 'Office ' + i,
                age: Math.floor(Math.random() * 100),
                start_date: '2021-01-01',
                salary: Math.floor(Math.random() * 100000)
            });
            updatePercentage(1);

            if (i === totalData - 1) {
                // Initialize DataTable with the fetched data
                $('#example').DataTable({
                    data: data,
                    columns: [
                        { data: 'name' },
                        { data: 'position' },
                        { data: 'office' },
                        { data: 'age' },
                        { data: 'start_date' },
                        { data: 'salary' }
                    ]
                });

                // Hide the loader once the data is fully loaded
                $('#loader').fadeOut();
            }
        }, i);
    }
});
Conclusion
Implementing a loading spinner with a percentage indicator can significantly improve user experience, especially when dealing with large datasets. By following this guide, you can create an engaging and informative loading process for your DataTables. Feel free to adjust the code to fit your specific needs and enhance it with additional features as required.
Related Articles:
- Automatically Setting the Current Date and Time in an HTML Form

- How to Create a Spinner with Loading Data Percentage in DataTables
- Convert Numbers to Khmer Number System Words (HTML+JAVASCRIPT)

- Converting Numbers to Words in JavaScript
- Create Login Form Using HTML, CSS, JavaScript

- JavaScript – Create Notes App